Apr 28 2021

Show All Available Icons in Diagram as Code

Published by under Python

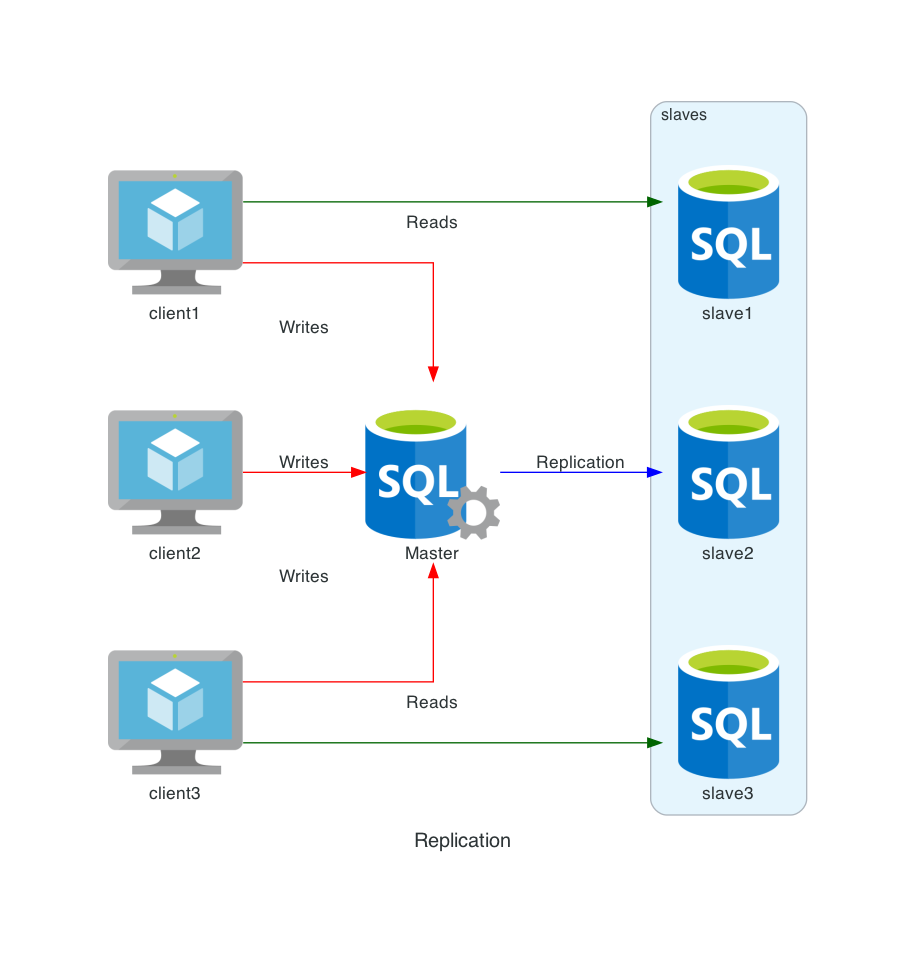
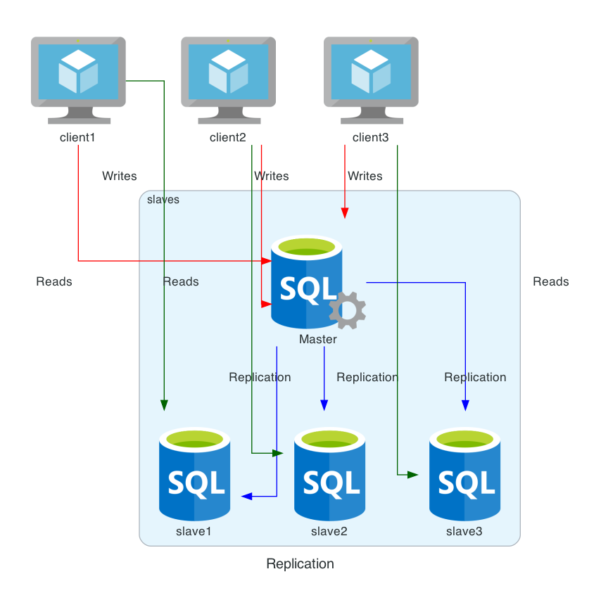
Diagram as Code by Mingrammer lets you draw beautiful diagrams while offering so many icons. It is just frustrating to go within all subdirectories to check and see all available icons. I decided to write a piece of code that imports classes from Diagram as Code package’s submodules.
I then gather each provider’s submodules in a cluster – that shows up as a blue area – and classes in green. A class matches a specific icon.

You will find on this image all icons available for your diagrams as code. Clic to expand image in bigger resolution, and right clic to save on your desktop.

Diagram as code all available icons


Here is the source code that generates above image that you can adapt to your needs to get all the latest icons.
You might want to show icons for a specific provider or generate separate images for each.

I had to link icons with one another so they display horizontally rather than a single unending vertical column. This is what the recursive function display_icons is for. For some reason, recursivity works removing the last element, but the first.

#!/usr/bin/env python3
 
import importlib
import pkgutil
import sys, inspect
 
import diagrams
from diagrams import Cluster, Diagram, Edge
 
def get_modules(module):
   path_list = []
   spec_list = []
   for importer, modname, ispkg in pkgutil.walk_packages(module.__path__):
      import_path = f"{module.__name__}.{modname}"
      if ispkg:
         spec = pkgutil._get_spec(importer, modname)
         importlib._bootstrap._load(spec)
         spec_list.append(spec)
      else:
         path_list.append(import_path)
   return path_list
 
def get_classes(module):
   class_list = []
   for name, obj in inspect.getmembers(module,inspect.isclass):
      if not name.startswith('_'):
         class_list.append([name,obj]) 
   return class_list
 
def add_module_to_provider_list(providers, module):
   # eg diagrams.azure.database
   # add "database" to array linked to key "azure"
   (diagram,provider,pclass) = module.split('.')
   if provider not in providers:
      providers[provider] = [pclass]
   else:
      providers[provider].append(pclass)
 
def get_provider_list(providers):
   return providers.keys()
 
def get_provider_classes(providers, provider):
   return providers[provider]
 
def display_icons(class_list):
   if len(class_list) < 1: return
   if len(class_list) == 1: return class_list[0][1](class_list[0][0])
   length = len(class_list)
   return display_icons(class_list[:-1]) - class_list[length-1][1](class_list[length-1][0])
 
if __name__ == "__main__":
   providers = {}
   modules = get_modules(diagrams)
 
   for module in modules:
      # Module exception
      # /usr/local/lib/python3.8/site-packages/diagrams/oci/database.py
      # NameError: name 'AutonomousDatabase' is not defined
      if module not in ['diagrams.oci.database']:
         add_module_to_provider_list(providers, module)
 
   with Diagram("all_Icons", show="False", outformat="png"):
      for provider in get_provider_list(providers):
         with Cluster(provider):
            for pclassname in get_provider_classes(providers, provider):
               with Cluster(pclassname):
                  classes = get_classes(importlib.import_module('diagrams.'+provider+'.'+pclassname))
                  display_icons(classes)
 

2 responses so far

Apr 13 2021

Make Ansible 6X Faster with these 3 Tips

Published by under Ansible

Ansible is generally slow because it connects to the remote host for every task it runs. Let’s do some checks on a tiny role that gets the latest kubectl version (Kubernetes client) from a URL and installs the binary.
Let’s see 3 easy ways how to speed up Ansible and get better execution times and overall performance.

- name: get kubectl last version
   uri:
     url: "{{kubectl_url}}/stable.txt"
     return_content: yes
     status_code: 200
   register: kubectl_latest_version
 

 - name: Download kubectl binary
   get_url:
     url: "{{kubectl_url}}/v{{ kubectl_version |
       default(kubectl_latest_version.content | 
       regex_replace('^v', '')) }}/bin/{{kubectl_os}}/{{kubectl_arch}}/kubectl"
     dest: "/usr/local/bin"
     mode: '755'
     owner: "{{ kubectl_owner }}"
     group: "{{ kubectl_group }}"


Execution time with default settings: 32,2s

Ansible Speed up
Speed up Ansible


Ansible Fact Cache

Gathering facts is the first task Ansible runs when connecting to a host and the least we can say, it is slow. Very slow. Performance is also an issue when writing a playbook that you are testing over and over.

Luckily, it can be tweaked to save some time by adding these lines in ansible.cfg:

# implement fact caching and a smaller subset of facts gathered 
# for improved performance

gathering = smart
gather_subset = !hardware,!facter,!ohai

fact_caching_connection = /tmp/ansible_fact_cache
fact_caching = jsonfile

# expire the fact cache after 2 hours
fact_caching_timeout = 7200


According to the ansible.cfg example available online, smart gathering “gathers by default, but doesn’t regather if already gathered”.

Hardware facts are the longest facts to retrieve but you may need them especially if you build roles based on network interfaces. You may get “ansible_eth0 is undefined” for example.
Facter and ohai are related to Puppet and Chef clients.

And the most efficient is fact caching of course that stores information in a JSON file. But it could also fit in memory, or even in a shared Redis database.

Facts can also be disabled within a playbook if you don’t need them for that specific playbook. That’s a potential significant speed up that you can’t use too often though, most playbooks need facts.

- name: my_playbook
    hosts: *
    gather_facts: no
    tasks:


Execution time: 19,2s


SSH Speedup with Pipelining

Enabling pipelining reduces the number of SSH operations required to execute a module on the remote server. This improves performance but ‘requiretty’ must first be disabled in /etc/sudoers on all managed hosts, reason why pipelining is disabled by default. Add in ansible.cfg:

[ssh_connection]
pipelining = True


If requiretty is set, sudo will only run when the user is logged in to a real tty.  When this flag is set, sudo can only be run from a login session and not via other means such as cron or cgi-bin scripts. However, this flag is off by default according to the man page on Debian and Ubuntu at least.
It is safe to use pipelining is this case. Check your Linux distro sudo man page.

Execution time: 11,6s

Delegate_to localhost

Most improvements are dependant on the way you write Ansible tasks. In this role, you could connect to the URL from any host – localhost? – and spare an SSH connection.
This is the purpose of delegate_to that is usually set to localhost. The first task becomes:

- name: get kubectl last version
   delegate_to: localhost
   become: false
   uri:
     url: "{{kubectl_url}}/stable.txt"
     return_content: yes
     status_code: 200
   register: kubectl_latest_version


This is a non neglectable optimisation that you can use anytime the task can be run anywhere.

You’d better set become: false or you might get this error message if Ansible tries to sudo as root on your local host.

fatal: [backup]: FAILED! => {"changed": false, "module_stderr": "sudo: a password is required\n", "module_stdout": "", "msg": "MODULE FAILURE\nSee stdout/stderr for the exact error", "rc": 1}


Execution time: 4,7s


Execution time is the mean time of 10 runs in a row, and tests were conducted through a VPN link that was far from good.

Of course, results are not linear, all playbooks will not run 6 times faster every time but you get the idea. Fact cache saves a few seconds at the start of the playbook while delegation to localhost is only applicable to a small bunch of cases.
There are other possible improvements to speed up Ansible such as async tasks to launch a task and move on immediately to the next one, but your best bet is to run Ansible on a server as close as possible to the target hosts, because people often experience slow SSH connections.


No responses yet

Apr 01 2021

Build Ansible Inventory from IBM Cloud Resources

Published by under Ansible,Python

IBM Cloud relies on Softlayer API – also called IBM Classic Infrastructure – to automate things. The API is available in different languages such as Python, Go, Java or PHP, and can be used to build an Ansible inventory.

manfredrichter / Pixabay

Here I will generate automatically a host inventory collected from my IBM Cloud account, directly usable by Ansible. I will also generate datacenters groups. You may want to fit servers in all kinds of categories such as Databases, Mysql, Linux, Web, etc… No worries, we can do that too in a really simple way.
This can be achieved adding tags to hosts on IBM Cloud portal and a host can indeed have multiple tags and belongs to Ansible groups matching these tags.

Once these groups are declared in the inventory file, you can apply Ansible playbooks like Install Apache package on servers that belong to the “Web” hostgroup for instance.


You first need to add your API key into a shell file you will execute before running the script. It could be in the script, but this allows each user to have his own key in a separate file. The API Key can be generated or found on IBM Cloud portal.

export SL_USERNAME=username
export SL_API_KEY=a1b2c3[...]3456


Run . ./IBM_SL_env.sh first to set username and API key into environment variables that will be used by the following Python script.

#!/usr/bin/env python3  
import os
import SoftLayer
 
HOST_VARS_DIR  = "host_vars"
INVENTORY_FILE = "inventory"
 
class Inventory:
   def __init__(self):
      # Variables
      self.categories = {}
      self.datacenter = {}
      self.servers = {}
 
      # Create Softlayer connection
      self.client = SoftLayer.create_client_from_env()
 
      # Init Methods
      self.get_server_list()
      self.write_inventory()
 

   def short_host_name(self, host):
      return host['fullyQualifiedDomainName'][:host['fullyQualifiedDomainName'].find('.mydomain.')]
 

   def add_host_to_cat(self, host, cat):
      if cat == "ibm-kubernetes-service": cat = "kube"
      if cat not in self.categories:
         self.categories[cat] = [host]
      else:
         self.categories[cat].append(host)
 

   def add_server_to_list(self, host):
      try:
         host["primaryBackendIpAddress"]
      except KeyError:
         pass
      else:
         host["ShortHostname"] = self.short_host_name(host)
             
         # Build server Categories list
         if host["tagReferences"] != []:
            for tagRef in host["tagReferences"]:
               self.add_host_to_cat(host["ShortHostname"], tagRef["tag"]["name"].strip())
             
         # Build datacenter lists
         if host["datacenter"]["name"] not in self.datacenter:
            self.datacenter[host["datacenter"]["name"]] = [host["ShortHostname"]]
         else:
            self.datacenter[host["datacenter"]["name"]].append(host["ShortHostname"])
             
         # Build server attribute list
         serverAttributes = {}
         serverAttributes['IP'] = host["primaryBackendIpAddress"]
         self.servers[host["ShortHostname"]] = serverAttributes
     

   def get_server_list(self):
      object_mask = "mask[id,fullyQualifiedDomainName," \
                    "primaryBackendIpAddress," \
                    "tagReferences[tag[name]]," \
                    "datacenter]"
 
      # Get virtual server list
      mgr = SoftLayer.VSManager(self.client)
      for vs in mgr.list_instances(mask=object_mask):
         self.add_server_to_list(vs)
 
      # Get bare metal servers
      hsl = SoftLayer.HardwareManager(self.client)
      for hs in hsl.list_hardware(mask=object_mask):
         self.add_server_to_list(hs)
 

   def write_inventory(self):
      # host_vars structure
      if not os.path.exists(HOST_VARS_DIR):
         os.makedirs(HOST_VARS_DIR)
 
      inventoryFile = open(INVENTORY_FILE,"w")
 
      for cat in self.categories.keys():
         if cat != "kube":
            inventoryFile.write("[" + cat + "]\n")
            for host in self.categories[cat]:
               # write host vars
               inventoryFile.write(host + "\n")
               file = open(HOST_VARS_DIR+"/"+host,"w")
               file.write("ansible_host: " + self.servers[host]['IP'] + "\n")
               file.close()        
            inventoryFile.write("\n")
      for dc in self.datacenter.keys():
         inventoryFile.write("[" + dc + "]\n")
         for host in self.datacenter[dc]:
            if not host.startswith("kube"):
               inventoryFile.write(host + "\n")
         inventoryFile.write("\n")
      inventoryFile.close()

if __name__ == "__main__":
   exit(Inventory())


A few notes:
Managed Kubernetes nodes are visible in IBM classic infrastructure like any other VM (VSI in IBM terminology) but you cannot connect on to them. They’re added to the “Kube” category before being ignored.

A distinct file is created in hosts_var for every server with its IP address. You could add more variables into it of course such as iSCSI settings, etc…

The script collects virtual machines as well as bare metal machines. You can comment out one of these sections if you don’t need it, saving one call to IBM.

Now you can build an Ansible inventory with IBM cloud hosts on the fly in less than 10 seconds.


No responses yet

Mar 25 2021

Free Gantt Charts Based on Time/Hours with Sparkline

Published by under Misc

I wanted to show the timeline of a disaster recovery plan on a Gantt style chart to make it look better than a boring list of tasks with start and end times, but I could not find any tool dealing with hours throughout a single day/24 hours.

Gantt software such as GanttProject also offer too many features that I don’t need just for a simple report. I decided to go for Sparkline function in Google Sheets: it is free, and remains quite easy even though it doesn’t work out of the box for hourly timelines. It is also available on Excel obviously.

What is Sparkline? Basically, Sparkline is a chart you embed in a single Excel (or other spreadsheet like Google Sheets) cell that gives you a trend. Bars chart are perfect for Gantt style timelines.

Google sheet gantt charts with Sparklines


There is no min, and max works only for numbers in bars charts, this is why I created the 2 columns Start delay and Duration in minutes. Basic formulas based on the project and task start and end times fill them automatically

=HOUR(D5-$D$3)*60+MINUTE(D5-$D$3); Start delay
=HOUR(E5-D5)*60+MINUTE(E5-D5); Duration


Sparkline cells are built from these 2 values; The first bar is white to start the coloured bar at the right place. Max value is the actual project duration

=SPARKLINE(F5:G5,{"charttype","bar";"color1","white";"color2","#199698";"max",$G$3})
 

No responses yet

Mar 14 2021

Draw Beautiful Diagrams with Diagram as Code

Published by under Python

Diagram as Code is a hot topic these days that brings a lof of benefits. Among them:
– Keep track of changes, who and what
– Store on a repository as simple text
– No need to realign arrows or move things around when you add an item
– Much faster as a consequence once you have the knowledge
– It is Code, and you know how much devs are fond of making manual diagrams
– Simply beautiful, everything is well-aligned
many icons available


An open source diagram library is available on diagrams.mingrammer.com in Python and Go. I will not go through the installation steps, everything is explained in the documentation. They also provide good diagrams examples.
I will try to translate an old diagram made on Microsoft Visio back then to a diagram as code. This image comes from a Mysql replication post.


Here’s the code I came up with and the generated image:

from diagrams import Cluster, Diagram, Edge
from diagrams.azure.compute import *
from diagrams.azure.database import *
 
with Diagram("Replication", show="False", direction='TB'):
 
  slaves = []
  clients= []
 
  master = SQLServers("Master")
  with Cluster("slaves"):
    for s in range(3):
      slave = SQLDatabases("slave"+str(s+1))
      slaves.append(slave)
 
  for c in range(3):
    client = VM("client"+str(c+1))
    clients.append(client)
    clients[c] >> Edge(color="darkgreen",label="Reads") >> slaves[c]
    
  clients >> Edge(color="red",label="Writes") >> master
  master >> Edge(color="blue",label="Replication") >> slaves[1]

Less than 20 lines of code, that’s all it takes. Icons are from Azure directory but I could have picked some others. The second image is basically the same thing but I removed the direction that becomes Left to Right. Labels are better handled in that direction as you can see, even if it’s still not perfect with multiple arrows.
I also removed the middle “Read” label for a better alignment and clarity linking single objects rather than arrays. I replaced

clients[c] >> Edge(color="darkgreen",label="Reads") >> slaves[c]


with (outside the for loop):

for i in [0,2]: clients[i] >> Edge(color="darkgreen",label="Reads") >> slaves[i]


It is sometimes a bit difficult to get what you want especially with multiple levels connecting to each other. Now you can experiment and change some behaviours playing around with Cluster grouping. It can be handy when you want Level 2 and 4 on the same place for instance but it can also get messy like in this Mysql Cluster:


In a nutshell, this implementation of Diagram as Code is powerful and efficient even though you lose some control on placing things. A small downside for a great library. Once you get familiar with all these little tricks, you can achieve some nice and beautiful diagrams. Here’s a basic Kubernetes architecture example:

Kubernetes diagram as code
 

No responses yet

« Prev - Next »