Mar 14 2021
Draw Beautiful Diagrams with Diagram as Code
Diagram as Code is a hot topic these days that brings a lof of benefits. Among them:
– Keep track of changes, who and what
– Store on a repository as simple text
– No need to realign arrows or move things around when you add an item
– Much faster as a consequence once you have the knowledge
– It is Code, and you know how much devs are fond of making manual diagrams
– Simply beautiful, everything is well-aligned
– many icons available
An open source diagram library is available on diagrams.mingrammer.com in Python and Go. I will not go through the installation steps, everything is explained in the documentation. They also provide good diagrams examples.
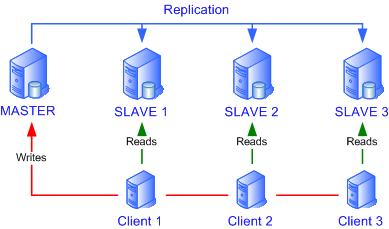
I will try to translate an old diagram made on Microsoft Visio back then to a diagram as code. This image comes from a Mysql replication post.
Here’s the code I came up with and the generated image:
from diagrams import Cluster, Diagram, Edge
from diagrams.azure.compute import *
from diagrams.azure.database import *

with Diagram("Replication", show="False", direction='TB'):

  slaves = []
  clients= []

  master = SQLServers("Master")
  with Cluster("slaves"):
    for s in range(3):
      slave = SQLDatabases("slave"+str(s+1))
      slaves.append(slave)

  for c in range(3):
    client = VM("client"+str(c+1))
    clients.append(client)
    clients[c] >> Edge(color="darkgreen",label="Reads") >> slaves[c]

  clients >> Edge(color="red",label="Writes") >> master
  master >> Edge(color="blue",label="Replication") >> slaves[1]
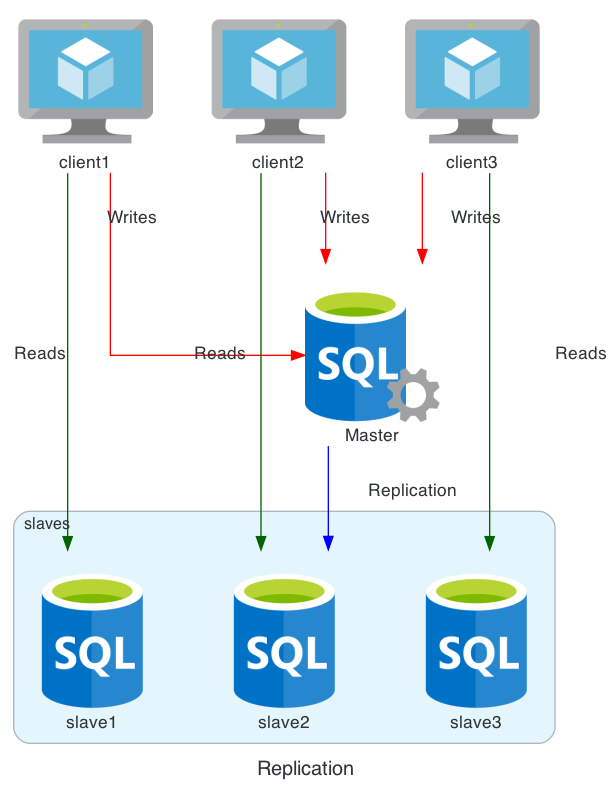
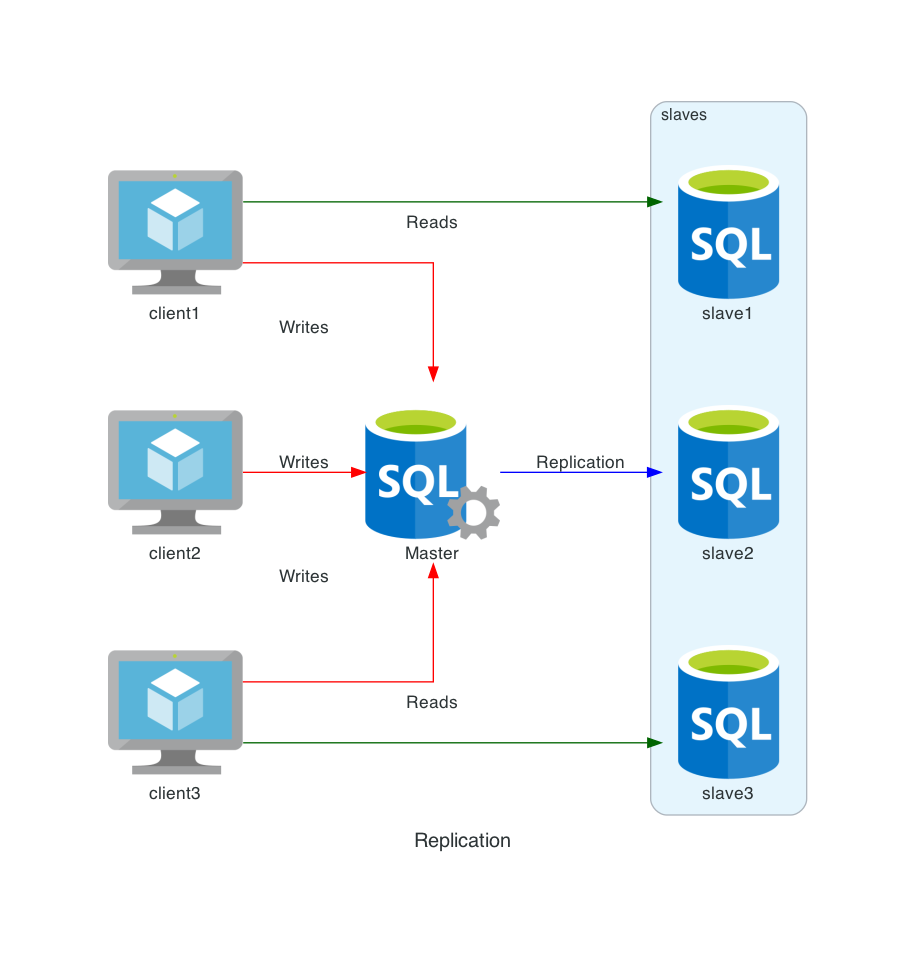
Less than 20 lines of code, that’s all it takes. Icons are from Azure directory but I could have picked some others. The second image is basically the same thing but I removed the direction that becomes Left to Right. Labels are better handled in that direction as you can see, even if it’s still not perfect with multiple arrows.
I also removed the middle “Read” label for a better alignment and clarity linking single objects rather than arrays. I replaced
clients[c] >> Edge(color="darkgreen",label="Reads") >> slaves[c]
with (outside the for loop):
for i in [0,2]: clients[i] >> Edge(color="darkgreen",label="Reads") >> slaves[i]
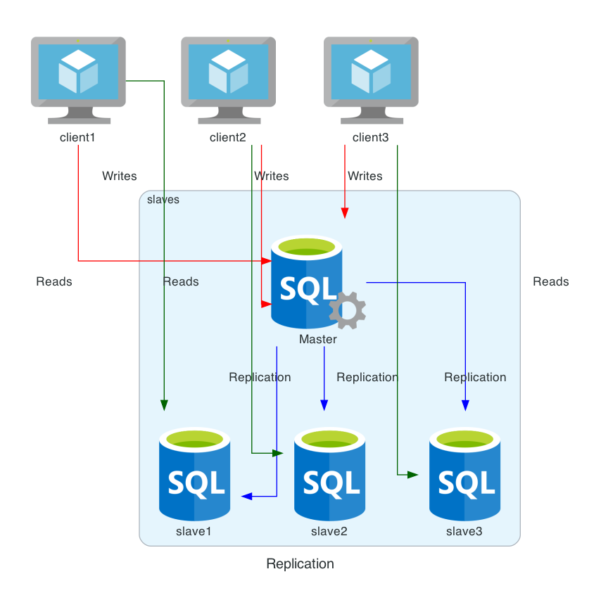
It is sometimes a bit difficult to get what you want especially with multiple levels connecting to each other. Now you can experiment and change some behaviours playing around with Cluster grouping. It can be handy when you want Level 2 and 4 on the same place for instance but it can also get messy like in this Mysql Cluster:
In a nutshell, this implementation of Diagram as Code is powerful and efficient even though you lose some control on placing things. A small downside for a great library. Once you get familiar with all these little tricks, you can achieve some nice and beautiful diagrams. Here’s a basic Kubernetes architecture example:
