May 11 2013
Freeradius Usage Graphs
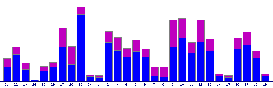
Radius servers generate a lot of accounting records. Is it worth keeping them? Of course! Beside the fact they could be used to check if a customer was connected at a given date, or find out who got IP address X.X.X.X that same day, the most interesting is to generate Freeradius traffic usage graphs and show customers their daily download and upload. This is particularly useful for Internet providers. Many other features can then be implemented on top of that:
– Bill customers based on traffic, with your own or a professional billing software
– Charge customers for each extra MB passed the quota
– Suspend or restrict download speed for abusing customers
– Or simply detect abusing customers
Those are only a few examples but there are many other applications that could be built from there.
Usage Graphs Features
These scripts are already used by Internet service providers but could be used by anyone really using Freeradius.
They provide:
– Customer’s IP detection. User doesn’t need to enter his username or IP address.
– Customizable header and footer
– Easy setup. Just uncompress the archive and set your system parameters, that’s it
– Admin section to monitor any customer
– Displays days with no data or zero traffic
To get best results, have a look here on how to update your Radius usage at regular intervals. If not, you will get many days with no traffic due to the Radius protocol sending accounting at the start and the end of a session. You will also need to setup Freeradius and send accounting to a Mysql, Postgresql or Oracle database. Perl and its DBI and GD modules are also required. Visit www.perl.com.
It is recommended to create indexes on UserName on tables radacct and radcheck to speed up the script.
Freeradius usage graph is compatible with all Freeradius up to last version 3.x
Freeradius Usage Graphs Download
 Want to give it a try? Get this Radius traffic reporting script for free from the download section right now!
Download ( hits)
Note: This version only supports Mysql. Check below for Postgresql and Oracle.
In order to improve those scripts, don’t hesitate to contact us at contact@netexpertise.eu to share your ideas.
Advanced Script
Benefit from new features added to the previous script
– Display per day or per month
– Display traffic or number of disconnections
– Define start and stop dates
– Interactivity through a form
– Pick up dates from calendar
– Customizable graph colors to match your site
– Postgresql and Oracle support
Check this DEMO out and get the advanced version for €20 only!![]()
Wow, useful info!
Hi there Dave, nice script, I have got it working where the script can generate the username then output the graph…but there is no data. The same mysql query does show data…
I’m new to perl so perhaps something is amiss with how the graph is output although I don’t have any visable errors.
Sorry for the noob question but is there a way to debug how the script outputs the graph?
Hi,
Make sure the settings are correct in the config file.
You can also check queries in the Perl script match your database schema (in case you changed some column names for instance)
Did you check your Apache logs?
Yes I did, thanks for the responce, and they show eveything been ok…. the db connection is made by graph.cgi and the query has been run successfully, the graph loads but shows no data.
I must assume that perl is not setup correctly although I followed this page and I tried it on 2 different servers.
http://www.livejournal.com/doc/server/lj.install.perl_setup.modules.html
I shall investigate how to debug the graph output, cheers.